
An Investigation on the Effects of Using Interactive Digital Video in a Physics Classroom on Student Learning and Attitudes
Lawrence T. Escalada and Dean A. Zollman
Department of Physics, Kansas State University, Manhattan, Kansas 66506-2601
(Published in Journal of Research in Science Teaching, 34(5),467-489 (1997))
Abstract
Interactive digital video provides students with control of computer visualization techniques and allows them to collect, analyze, and model two-dimensional motion data. Activities that utilize these techniques were developed for students to investigate the concept of frames of reference in various real-life situations. This investigation examines the effect on student learning and attitudes of using these materials in an introductory college physics course.
The study measured students' computer attitudes and found improvement in students' feelings of comfort in using computers after completion of the activities. We found students' prior computer experience did not influence their perceptions of the activities. The majority of participants perceived discussion and the computer visualization techniques as being very effective in helping them learn. Students' understanding of the physics concepts were assessed and the participants' scores were compared with non-participants' scores. Although ANOVA statistical procedures revealed no significant differences between the two groups, the results of this study indicate that sophisticated instructional video software can be perceived as easy-to-use and effective by students who are novices and experts in using computers. Thus, the interactive digital video tools and activities have the potential to provide physics teachers with the latest technology to bring the active process of learning physics in their classroom.
Introduction
Demonstrations and laboratory experiences have always been important components for the reinforcement and understanding of physics concepts. Visualization of phenomena through such techniques as demonstrations, simulations, models, real-time graphs, and video can contribute to students' understanding of physics concepts by attaching mental images to these concepts. These visualization techniques "not only allow the students to see first hand how things behave, but also provide them with visual associations that they may capture, and preserve the essence of physical phenomena more effectively than do verbal descriptions." (Cadmus, 1990)
Laboratory experiences provide students with the important experience of meeting "nature as it is, rather than in idealized form" (Hershey, 1990), and with the opportunity to develop skills in scientific investigation and inquiry. Laboratory experiences that utilize hands-on inquiry have been considered one of the most effective methods for learning about science and developing the higher order thinking skills necessary to "do" science (Hoffer, Radke, & Lord, 1992; Shymansky, Kyle, & Alport, 1983). Shymansky et al. reported that students in such courses generally had better attitudes toward learning about science and toward scientists; better higher-level intellectual skills such as critical and analytical thinking, problem solving, creativity, and process skills; as well as, a better understanding of scientific concepts when compared to students in courses that do not utilize hands-on inquiry.
Research on the effectiveness of activity-based science programs, however, has produced a variety of results when various measures of student achievement have been analyzed (Stohr-Hunt, 1996). Stohr-Hunt points out that some research implies that such programs are highly successful, whereas other studies have indicated that these methods are no better than traditional methods of instruction. For example, Atash & Dawson (1986) reexamined one of the activity-based science programs that were included in the Shymanksy et al. study and found that students in these programs did not achieve as well as students in traditional science programs. Stohr-Hunt found that eight-grade students who experience hands-on activities either every day or once a week score significantly higher on standardized tests than eight-grade students who experience hands-on activities once a month, less than once a month, or never.
Although the research done on the effectiveness of activity-based programs have produced mixed results, national educational reform efforts such as the National Science Education Standards (National Research Council, 1996) recommend that the learning of science should be an active process for all students so that each student enrolled in a science curriculum can achieve a better understanding and appreciation of science. Active process described by the Standards implies a physical ("hands-on") and mental ("minds-on") activity. According to the Standards, science teaching must involve students in inquiry-based investigations in which:
Laboratory experiences that utilize visualization techniques in the form of simulations, models, real-time graphs, and video would provide opportunities for students not only to develop their understanding and reinforcement of physics concepts, but also to develop their skills in scientific investigation and inquiry. Incorporating these visualization techniques into the laboratory experience would provide an opportunity for students to become involved in the active process of learning science as described by the Standards.
Laboratory experiences provide students with the important experience of meeting "nature as it is, rather than in idealized form" (Hershey, 1990), and with the opportunity to develop skills in scientific investigation and inquiry. Laboratory experiences that utilize "hands-on" inquiry have been considered one of the most effective methods for learning about science and developing the higher order thinking skills necessary to "do" science (Shymansky, Kyle, & Alport, 1983; Hoffer, Radke, & Lord, 1992). The 1994 Draft of the National Science Education Standards describes the learning of science as an active process (National Research Council, 1994). Active process as described by the Standards implies a physical ("hands-on") and mental ("minds-on") activity. According to the Standards, science teaching must involve students in inquiry-based investigations in which:
Laboratory experiences that utilize various forms of visualization techniques would provide opportunities for students not only to develop their understanding and reinforcement of physics concepts, but also to develop their skills in scientific investigation and inquiry. Incorporating visualization techniques into the laboratory experience would provide an opportunity for students to become involved in the active process of learning science as described by the Standards.
The Use of Technology in the Physics Classroom
The use of computers in physics courses has increased substantially in the last ten years. Computers can provide students with quick and easy access to various forms of information through the Internet or extensive CD-ROM databases like the Physics InfoMall (Fuller & Zollman, 1995). Computers can reinforce concepts by various forms of drill, practice, and tutorial work and, when connected to various interfacing devices, can be very helpful in laboratory situations for data analysis and collection. Computers can also be used to simulate experiments that would otherwise require expensive equipment (e.g., Millikan oil drop experiment) or would expose students to unnecessary hazards (e.g., counting experiments with radioactive samples). In addition, computer simulations and animations can provide concrete experiences for students to visualize physical phenomena at the atomic level which can be used to introduce abstract quantum principles (Escalada, Rebello, & Zollman, 1996).
An example of how computers can be connected to various interfacing devices for data analysis and collection is the use of microcomputer-based laboratory (MBL) tools. In MBL, computer programs are used in conjunction with computer hardware (sensors or probes) which are connected to the computer through a serial interface. These computer programs collect analog data (e.g., motion, force, and temperature) about a physical system, convert that data to digital input, and then transform them into a graph while the data are being collected (called a real-time graph). The use of MBLs allow students to quickly acquire, manipulate, and analyze real-time data which can be viewed in multiple representations such as events, graphs, tables, and equations (Kelly & Crawford, 1996).
Brasell (1987) and Thornton & Sokoloff (1990) found students using real-time graphs with MBL significantly improved their kinematics graphing skills and their understanding of the qualitative aspects of motion which they observed as compared to students using delay-time graphs (graphs produced after the motion of an object).
Beichner (1990) analyzed the effect of MBL on student learning in a high school and college physics classroom by comparing the understanding of kinematics between those students who were taught by demonstrations and computer simulations of videotaped images and those students who were taught by MBL techniques. Beichner found those students taught by demonstrations and computer simulations did not achieve as well as those students taught by MBL techniques. Beichner 's results also suggested that direct personal control of the computer and/or the experience of producing the graph produced the enhanced MBL learning.
Although Brungardt and Zollman (1996) found no significant learning difference between using real-time and delay-time analysis for understanding of kinematics graphs when students analyzed videodisc-recorded images of sporting events, their results imply real-time analysis may have some advantages. For example, the students who used real-time graphs were aware of the simultaneous-time effect and seemed motivated by it. Real-time students demonstrated decreased eye movement between the computer and video screens as subsequent graphs were produced. These students also demonstrated more discussion during graphing than delayed-time students. In addition, real-time students displayed less confusion between velocity versus time and acceleration versus time graphs than did delayed-time students and spent less time on the insignificant details of the graphs than delay-time students.
Workshop Physics, an activity-based introductory college physics course with no formal lectures, is an example of a program that incorporates computer technology into real experiences and where students can develop their inquiry skills (Laws, 1991). Workshop Physics integrates various computer applications in a computer network to be used by students in activities where they observe phenomena, analyze data, and develop verbal and mathematical models to explain their observations. The computer applications used in Workshop Physics include: various types of MBL tools to collect data and to display graphs of data in real time, dynamics spreadsheets and graphs for data analysis and numerical problem solving, computer simulation programs for phenomena not conducive to direct observation, and video analysis tools to analyze the motion of objects (Laws, 1995).
When analyzing the effect of Workshop Physics on student learning by comparing students' performance before and after the course, Laws found dramatic improvements in student conceptual learning in the topics of kinematics, dynamics, latent heat, and electricity. These improvements in student learning resulted only after discussion, observations, and predictions were integrated into the program. Laws also reported student attitudes were more positive about the mastery of computer applications than any other aspect of the Workshop Physics course (Laws, 1991).
Interactive Digital Video
The computer-based video technology used in Workshop Physics collects and analyzes two-dimensional motion data that was recorded on videodisc and student-generated videotapes (Laws, 1991). The interactive video technology used to collect motion data from student-generated videotapes incorporates a comparable data-collection method that is used by MBL. Interactive video, like MBL, can produce real-time graphs of the motion of the objects being investigated. Interactive video, however, unlike MBL, can analyze complex two-dimensional motion such as the motion of a "cannonball" fired from a projectile launcher (Escalada, Grabhorn, & Zollman, 1996). Interactive video, unlike MBL, allows students to observe real-time graphs of the data being collected at the same time the video of the event is shown (Chaudhury & Zollman, 1994). The use of interactive video can eliminate the need for special experimental apparatus, connecting wires to computer interfaces, and setting up photogates or sonic rangers typically found in MBL situations so that students can focus on analyzing the data rather than on the apparatus (Graney & DiNoto, 1995). Interactive video can also provide students with opportunities to collect and analyze data taken from "real world" phenomena that occur outside the classroom. For example, students can use interactive video to collect and analyze video of the motion of a high jumper as he is "clearing" the beam (Zollman, Noble, & Curtin, 1987), a NASA lunar module making an ascent from the moon or of the elements of a somersault dive by a platform diver (Laws & Cooney, 1996).
For many years, the computer visualization techniques of interactive video were limited to the videodisc which allowed physics students to collect data from the motion of pre-recorded laboratory or "real-world" events. Thus the random-access videodisc has played a prominent role in interactive-video instruction by providing students with already captured video for collecting data. These video sequences often represent interesting physical phenomena that are not easily reproduced or simulated in the laboratory. Several techniques and videodiscs for this type of data collection and interaction have been developed (Zollman & Fuller, 1994).
However, recent advances and decreased costs have resulted in the increased availability of interactive multimedia equipment and in improvements in displaying full-motion video on a computer monitor. The capture capabilities of computer digital video systems now allow the teacher and students to capture video of experiments they performed themselves by storing the video on their computer's hard drive. A variety of visualization techniques associated with this technology have been developed and are available for the student to play back and analyze the motion of objects in video (Escalada, Grabhorn, & Zollman, 1996; Beichner, 1996; Laws & Cooney, 1996; Patterson, 1996; Wilson & Redish, 1992). This type of computer-based video technology, when used in the science classroom has called video-based laboratory or VBL tools (Rubin, 1993).
VBL enables a user to connect any video source-camera, VCR, or videodisc player-and digitize the incoming analog signal. The resulting digital data is then stored on the hard drive of the computer. This technique is relatively new and, at present, no industry standard exists for the format of the video or the hardware on which it is played. The most popular forms in use are QuickTime, Video for Windows, and Digital Video Interactive (DVI). The most recent version of DVI is Intel's ActionMedia II. They differ in the hardware used, the compression techniques which enable one to store video on a hard drive, and the type of computer platform used. QuickTime, DVI, and Video for Windows are available for both Macintosh and MS-DOS computers.
By developing a variety of techniques for the use of interactive digital video, we and others have offered teachers many ways to use this visualization medium in the teaching of physics. We have focused on using these types of visualization techniques as laboratory tools for investigation and inquiry. This focus is consistent with the recommendations made by the Standards that science curricula and programs for all students at all grade levels emphasize the acquisition of scientific understanding through investigation and inquiry.
Interactive digital video offers the means to help students make connections between the concrete, everyday experiences and the abstract models and general principles of physics. By using analysis tools on video scenes, students can collect quantitative data from complex events. They may use these data to create a simplified model of the event (Zollman, Noble, & Curtin, 1987). With modern digital techniques, students can create a visual representation of their model and display it directly on the video scene. In this way students can make direct visual comparisons between complex events and simplified scientific models.
The digital format also allows direct manipulation of the video images--frequently called video or image processing. With appropriate software, students can combine images from different video frames and modify the presentation of motion on the screen. These techniques have been used on concrete representations similar to the space-time diagrams used in the Theory of Relativity and to change synthetically the reference frame from which students view the event (Escalada, Zollman, & Grabhorn, 1996; Chaudhury & Zollman, 1994). Thus, the relation between real events and the formalism of physics can be greatly enhanced with digital video.
Interactive Digital Video Activities
The computer-based video technology used in Workshop Physics collects and analyzes two-dimensional motion data that was recorded on videodisc and student-generated videotapes (Laws, 1991). The interactive video technology used to collect motion data from student-generated videotapes incorporates a comparable data-collection method that is used by MBL. Interactive video, like MBL, can produce real-time graphs of the motion of the objects being investigated. Interactive video, however, unlike MBL, can analyze complex two-dimensional motion such as the motion of a "cannonball" fired from a projectile launcher (Escalada, Grabhorn, & Zollman, 1996). Interactive video, unlike MBL, allows students to observe real-time graphs of the data being collected at the same time the video of the event is shown (Chaudhury & Zollman, 1994). The use of interactive video can eliminate the need for special experimental apparatus, connecting wires to computer interfaces, and setting up photogates or sonic rangers typically found in MBL situations so that students can focus on analyzing the data rather than on the apparatus (Graney & DiNoto, 1995). Interactive video can also provide students with opportunities to collect and analyze data taken from "real world" phenomena that occur outside the classroom. For example, students can use interactive video to collect and analyze video of the motion of a high jumper as he is "clearing" the beam (Zollman, Noble, & Curtin, 1987), a NASA lunar module making an ascent from the moon or of the elements of a somersault dive by a platform diver (Laws & Cooney, 1996).
For many years, the computer visualization techniques of interactive video were limited to the videodisc which allowed physics students to collect data from the motion of pre-recorded laboratory or "real-world" events. Thus the random-access videodisc has played a prominent role in interactive-video instruction by providing students with already captured video for collecting data. These video sequences often represent interesting physical phenomena that are not easily reproduced or simulated in the laboratory. Several techniques and videodiscs for this type of data collection and interaction have been developed (Zollman & Fuller, 1994).
However, recent advances and decreased costs have resulted in the increased availability of interactive multimedia equipment and in improvements in displaying full-motion video on a computer monitor. The capture capabilities of computer digital video systems now allow the teacher and students to capture video of experiments they performed themselves by storing the video on their computer's hard drive. A variety of visualization techniques associated with this technology have been developed and are available for the student to play back and analyze the motion of objects in video (Escalada, Grabhorn, & Zollman, 1996; Beichner, 1996; Laws & Cooney, 1996; Patterson, 1996; Wilson & Redish, 1992). This type of computer-based video technology, when used in the science classroom has called video-based laboratory or VBL tools (Rubin, 1993).
VBL enables a user to connect any video source-camera, VCR, or videodisc player-and digitize the incoming analog signal. The resulting digital data is then stored on the hard drive of the computer. This technique is relatively new and, at present, no industry standard exists for the format of the video or the hardware on which it is played. The most popular forms in use are QuickTime, Video for Windows, and Digital Video Interactive (DVI). The most recent version of DVI is Intel's ActionMedia II. They differ in the hardware used, the compression techniques which enable one to store video on a hard drive, and the type of computer platform used. QuickTime, DVI, and Video for Windows are available for both Macintosh and MS-DOS computers.
By developing a variety of techniques for the use of interactive digital video, we and others have offered teachers many ways to use this visualization medium in the teaching of physics. We have focused on using these types of visualization techniques as laboratory tools for investigation and inquiry. This focus is consistent with the recommendations made by the Standards that science curricula and programs for all students at all grade levels emphasize the acquisition of scientific understanding through investigation and inquiry.
Interactive digital video offers the means to help students make connections between the concrete, everyday experiences and the abstract models and general principles of physics. By using analysis tools on video scenes, students can collect quantitative data from complex events. They may use these data to create a simplified model of the event (Zollman, Noble, & Curtin, 1987). With modern digital techniques, students can create a visual representation of their model and display it directly on the video scene. In this way students can make direct visual comparisons between complex events and simplified scientific models.
The digital format also allows direct manipulation of the video images--frequently called video or image processing. With appropriate software, students can combine images from different video frames and modify the presentation of motion on the screen. These techniques have been used on concrete representations similar to the space-time diagrams used in the Theory of Relativity and to change synthetically the reference frame from which students view the event (Escalada, Zollman, & Grabhorn, 1996; Chaudhury & Zollman, 1994). Thus, the relation between real events and the formalism of physics can be greatly enhanced with digital video.
Interactive Digital Video Computer Programs
We have developed computer programs that give students control of computer visualization techniques associated with interactive digital video. These interactive computer programs, Video Analyzer and Visual Space-Time, allow students to collect, analyze, and model two-dimensional motion data from observable events which occur outside the classroom (Escalada, Zollman, & Grabhorn, 1996). These programs utilize Intel’s ActionMedia II digital video format in the Windows environment. As described in Chaudhury & Zollman (1994), our interactive digital video tools allow students to: (1) use the same random access, still frame, step frame, and slow play capabilities found in standard videodisc technology; (2) collect, analyze, and model data from any event which can be recorded in a video format; (3) collect two-dimensional spatial and temporal data about any object on the screen; (4) play video from frames of reference different from the ones in which they were recorded; and (5) combine parts of successive video images into a single image. This single image, which is called a visual-time diagram, is literally a "video" position-time graph of the objects’ motion on the screen. Video Analyzer and Visual Space-Time provide the tools for this analysis and were used in the study described in this paper.
Interactive Digital Video Activities
We developed a set of five activities in which students utilize Video Analyzer and Visual Space-Time to capture, play back, and analyze the motion of various objects as viewed in various reference frames (Escalada, Grabhorn, & Zollman, 1996). The activities were designed to engage students in scientific inquiry by providing them with opportunities to explore and apply the concept of reference frames and other physics principles in various story-line real-life problems.
Each activity begins with a short introduction to the story-line problem. These problems which are modeled by the activities cover various physics concepts. Table 1 illustrates the physics topic and the story line found in each activity. Figure 1 shows how the storyline of a circus performer that is fired from a cannon into a net is introduced in the "Human Cannonball" activity. Each activity was designed to take about 60 to 90 minutes for students to complete.
Table 1 Physics topics and story lines found in the video activities
|
Activity |
Physics topics |
Story line |
|
|
Linear motion |
A race car driver in a race |
|
|
Elastic/inelastic collisions |
A group of friends on a bumper car ride |
|
|
Momentum of conservation |
A group of friends on a bumper car ride |
|
|
Falling objects |
A pilot dropping a care package to a camp from a plane |
|
|
Projectile motion |
A circus performed fired from a cannonball |
In these activities, the students investigate the relationships between reference frames and the concepts associated with each topic by capturing the video of experiments which they perform and by using one or both of the interactive video tools to analyze the motion of various objects. For example, in the "Human Cannonball" activity students use the Video Analyzer computer program to investigate the path of the ball ("cannonball") fired from a projectile launcher which is mounted along with a small camera to a dynamics cart on a track in various configurations of the carts’ motion (See "Human Cannonball" Apparatus on Figure 1). The "target" for the "cannonball" consists of a toy butterfly net mounted to an identical cart on a parallel track. By using the Video Analyzer program to trace the path of the "cannonball" in different configurations of the carts’ motion, students are engaged in concrete hands-on experiences with the concept of reference frames and the term, "relative". To further develop and reinforce students’ understanding of reference frames, the students also complete a number of relative position exercises in which they place diagrams (stickers) of the "cannon" and "target" in positions relative to one another when the "cannon" fires and when the "cannonball" lands in the "target".
The instructional techniques utilized in these activities to develop and reinforce student understanding of the relationships between reference frames and the concepts associated with each activity include: reading the storyline, performing the experiment, capturing the video, playing back the video, drawing visual space-time diagrams, tracing the motion of the objects, completing relative position exercises, making measurements and calculations, completing application questions, solving problems, and discussing the results. These instructional techniques and the activities are described in more detail in the article written for the Journal of Educational Multimedia and Hypermedia (Escalada, Zollman, & Grabhorn, 1996).
Purpose of the Study
This study was designed to address these general research questions: (1) How would students who have do not have strong backgrounds in mathematics, science, and computers respond to these interactive digital video tools and activities and (2) Would it be feasible to implement these activities within an existing activity-based physics course designed for these types of students? This study investigates the effects on student learning and attitudes of using the interactive digital video tools and activities in an introductory college physics classroom. It analyzes students' perceptions of the effectiveness of the various instructional techniques used in the activities in helping them learn the physics concepts and examines their attitudes toward computers and the relationship of these attitudes with students' prior computer experience. Further, student understanding and application of the physics concepts involved with the activities were assessed. The study compares participants' (students who completed at least one activity) performance on these assessments with non-participants' performance on these assessments.
You are the manager of a circus which is losing money. To attract more business, the owner suggest that you add a human cannonball to the acts. "But," he laments, "every circus has a human cannonball."
At least half joking, you reply, "Well then, how about shooting someone out of a moving cannon?"
"Great idea," he says, "but how will the driver of the cannon know when to fire? Oh well, that's not my problem; it's yours. I know you will think of something. We'll do it next week!
The circus performers, although known for their bravery, refuse to serve as test cases by allowing you to shoot them into a safety net. They demand that you first demonstrate to them that you can at least hit the net, so we've provided you with the model of the human cannonball act. The model includes:
"HUMAN CANNONBALL" APPARATUS
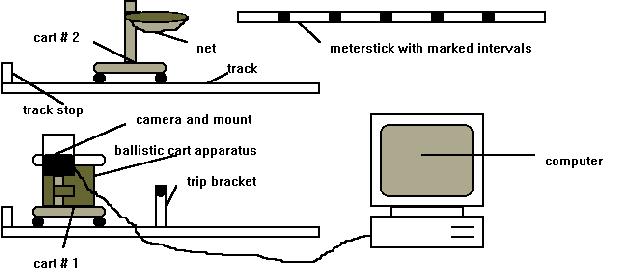
*NOTE: In reality, Cart #2 and its track are not elevated above Cart #1 and its track. The above illustration is intended to illustrate the complete set-up for the activity.*
Your job will be to use this equipment and the physics that you already know to help you launch the "human cannonball" into the net while the truck drives past. The video camera is connected to a computer to enable you to capture the video and analyze each shot. After each analysis you can make appropriate adjustments.
Figure 1. The human cannonball activity.
Concepts of Physics
The participants were students enrolled in an introductory level physics course, Concepts of Physics, for future elementary school teachers (Zollman, 1990) during the 1994 Fall Semester at Kansas State University. The students enrolled in this class do not have strong backgrounds in mathematics, science, and computers and thus traditionally avoid physics. The instructional method for the course is based on the learning cycle developed by Karplus (1977) and utilizes an open laboratory environment for hands-on exploration and application activities as well as a discussion format for the introduction of new concepts.
"Lab Studio" Environment
All 100 students in the class were given the opportunity to participate in completing up to three of the five activities for extra credit. Thus, the students were assigned to the participant and non-participant groups by a self-selection process. When the participants attended their first activity, they completed an initial computer attitude survey. Students were given up to 2 hours outside the regular schedule of the course to complete each activity so they could work at a pace that was comfortable for them. This time frame was similar to the time frame used in the Concepts of Physics course for students to complete each hands-on activity. Because each activity took place outside of the course, a short period of time was also desired to accommodate students’ academic schedules so that all 100 students enrolled in the course would have numerous opportunities to participate in the activities. A short time-frame made it very conducive to collecting feedback on the activities from as many of the students as possible.
Three students would work as a group in a "lab studio" setting, where the participants were given all the necessary materials and equipment to record and analyze their own video of each experiment. The equipment required to complete each activity was set up for the students, and they were given all necessary resources to complete it.
The participants were encouraged by a proctor to work as a group and to participate in group discussions about aspects of the activity. The proctor took the role of a technical consultant and facilitator but not an instructor for each activity.
After completing each activity, the participants completed an evaluation of it. At the end of the semester, the participants completed an evaluation of the activities and a second computer attitude scale. The non-participants were students who did not participate in the extra-credit activities and as such were not asked to complete the computer attitude scales or the evaluation of the activities. Both participants and non-participants completed a final exam which included questions that were specifically developed to assess their understanding and application of the concepts addressed in the activities.
Measuring Instruments
Computer Attitude Scale
The Attitudes Toward Computer Technologies (ACT) instrument is used to measure student perceived usefulness of and comfort/anxiety with computer technologies (Delcourt & Kinzie, 1993). The ACT instrument is a Likert-type questionnaire that was developed and initially validated for use with teacher education students and practicing teachers. Kulik, Kulik, & Bangert-Downs (1985) and Loyd & Gressard (1984a) encourage the evaluation of computer-based education programs in terms of student attitudes towards computers.
The ACT instrument contains a total of 19 items, 8 items called factor I (positively and negatively phrased) items that measure perceived Comfort/Anxiety (e.g., "I feel comfortable about my ability to work with computer technologies.") and 11 items consisting of factor II (positively phrased) items and factor III (negatively phrased) items that measure perceived Usefulness (e.g., "Communicating with others over a computer network can help me to be a more effective teacher.").
Delcourt & Kinzie administered the ACT instrument to 328 undergraduate and graduate students enrolled in education courses at six universities across the country. Data from these administrations was used to examine the internal consistency (alpha) reliability of the ACT instrument. Alpha reliability for the entire ACT instrument was fairly high (.89); as were the reliability values obtained for the two conceptual factors (Comfort/Anxiety, .90; Perceived Combined Usefulness, .83). According to Gable (1986), reliability figures of above .70 are acceptable levels for an attitude measure.
Modifications were made to the ACT instrument to make it more applicable to our investigation. These modifications included slight changes in the wording of several items. The resulting Computer Attitude Scale (CAS) instrument assessed student attitudes toward computer applications which were described as computer software, computer interface equipment, computer-video equipment, and computer networks. Thus, computer applications included computer software and video equipment which would be used in the video activities.
One factor III item was eliminated so that the number of factor III items would match the number of factor II items in the CAS instrument. Likert (1932) recommended that items should be equally balanced between positively and negatively phrased statements. In addition, student scores for factor II and III items were combined into one score to measure perceived usefulness of computers by averaging the two scores. The combined factor II and III score would be referred as factor IIc scores for the CAS instrument.
The students were asked to express their level of agreement or disagreement with the statements found in CAS. They were advised that the scale was assessing their beliefs, feelings, and behaviors in relation to computers and that there were no wrong or right answers.
Interactive Digital Video Activity Evaluation
After completing an activity, the participants were asked to complete an activity evaluation form. On the evaluation form, the participants were asked to: (1) rate the ease-of-computer use for the activity, (2) rate how well their group members worked together in completing the activity, (3) rate the effectiveness of various instructional techniques used in the activity in helping them learn the physics concepts, and (4) write comments on any aspect of each activity they liked or disliked. Each activity evaluation utilized a 5-point response format where students were asked to rate the level of ease-of-computer use, how well their group worked together, or effectiveness for each item.
Final Exam
The final exam for the course, consisting of 75 multiple choice questions, contained 14 questions that were used to assess the student's mastery of the concepts found in the activities. These questions assessed student understanding and application of the following concepts associated with the activities: reference frames, motion, elastic and inelastic collisions, conservation of momentum, free fall motion, and projectile motion. Figure 2 illustrates two examples of the multiple choice questions that were used.
Figure 2. Multiple choice questions related to Activity 4.
Experimental Designs
A one group pre-test and post-test design was used when comparing initial and final student computer attitude scale scores. T-tests for related samples were calculated for student pre-test and post-test factor I scores and for student pre-test and post-test factor IIc scores. An one-way ANOVA (analysis of variance) was calculated for factor I and IIc scores across computer experience levels. Computer experience was categorized into three levels: 0-1, 2-3, and >3. These levels were determined by adding the student’s number of years of computer experience to the number of computer courses they completed.
A one group post-test design was used when comparing student ratings of ease-of-computer use and of the activity's effectiveness across computer experience levels. One-way ANOVA's were calculated for comparing these ratings across computer experience levels.
A non-equivalent control group design was used when comparing activity related final exam scores of participants with non-participants. ANCOVA's (analysis of covariance) were calculated for comparing scores on activity related final exam questions using the final exam score as a covariate.
Participants
Eighty four of the 87 participants (74 females and 10 males) completed the initial CAS instrument and provided information about their gender, age, education, and computer experience. The participants were categorized into six age groups: 18-21, 22-25, 26-29, 30-33, and >33 years of age. Seventy-four percent of the participants were in the 18-21 age group and 16% of the participants were 26 years old or older. Fifty-nine percent of the participants were in their sophomore year of college and 30% of the participants were in their junior year of college. These figures reflect the type of students who enroll in the Concepts of Physics course: predominantly female students in their sophomore year of college who are between the ages of 18-21.
Fifty-six percent of the participants had a year or less of computer experience and 80% of them had taken one or no computer courses. Although the majority of the participants had little prior computer experience, Figure 3 illustrates that the majority of them had some experience with computer software (79%) and an IBM compatible computer that uses Windows (60%). Figure 3 also reveals that less than a fourth of the participants had prior experience in using computers with video capabilities (21%).
Figure 3. Percentage of students who completed the initial CAS with experience in the following computers and applications (n = 84).
Results and Discussion
Computer Attitude Scale (CAS)
Table 2 summarizes the results of comparing the pretest factor I and IIc mean scores with the post-test mean scores for the participants who completed both CAS instruments. The factor I pre-test and post-test scores, being slightly greater than the neutral factor I score (24), indicate that the participants felt somewhat comfortable in using computer applications before and after the activities were completed. The results of the one-tailed t-test for related samples revealed that the participants’ feelings in using computer applications (factor I) significantly improved during the semester. The improvement in students' feelings of comfort in using computer applications could be attributed to their participation in the video activities, but improvement could also be attributed to computer experiences outside the activities during the semester. One example is the Concepts of Physics course itself, where some basic computer simulations were used during the semester. However, few of the students used computer technology in any of their other courses. Thus, the change is likely to be due to the use of our interactive video activities.
Table 2 also shows that the pre-test and post-test mean scores for perceived general usefulness of computer applications (factor IIc) are greater than the neutral factor IIc score (15) which indicate that the students perceived computer applications to be fairly useful before and after completing the video activities. The t-test used to compare the pre-test and post-test factor IIc mean scores revealed that students' perception of computer application usefulness did not change as a result of participating in the video activities. This result is surprising because based on the students' experience in computer applications, one would believe exposure to these types of computer applications would result in higher perceptions of computer application usefulness. However, in this case, the students perceived a rather high usefulness before starting the activities. Thus, they were relatively close to the maximum and all gains are necessarily small.
Table 3 summarizes the results of controlling student pre-test CAS factor I mean scores for computer experience and age. The range of student pre-test factor I scores varied from 10 which is associated with the highest level of anxiety in using computer applications to 40 which is associated with the highest level of comfort in using computer applications.
Table 2 Participant means (and standard deviations) and t values for pretest and posttest CAS factors (n = 69).
|
|
Pretest means |
Posttest means |
T Values (pretest and posttest) |
|
Factor I |
27.19 (5.81) |
28.52 (5.90) |
tobt (69) = 3.18 (tc = 1.67, p < .05) |
|
Factor IIc |
20.58 (2.31) |
20.80 (2.49) |
tobt (69) = .835 (tc = 1.67, p > .05) |
Table 3 Participant means (and standard deviations) and t values for pretest and posttest CAS factors (n = 69).
|
Computer experience |
0-1 |
2-3 |
>3 |
|
Age (yr) 18-21 |
25.76 (5.80)n=21 |
25.70 (5.80) n=21 |
31.60 (4.64) n=20 |
|
22-25 |
29.50 (3.57) n=4 |
29.50 (3.50) n=2 |
32.30 (5.44) n=3 |
|
26-29 |
27.00 (5.39) n=4 |
|
25.00 (¾ ) n=1 |
|
30-33 |
27.00 (3.27) n=3 |
28.00 ( ¾ ) n=1 |
|
|
>33 |
18.70 (6.18) n=3 |
|
40.00 ( ¾ ) n=1 |
Because of small sample sizes found in some of these groups, it was difficult to make meaningful comparisons of mean scores between the groups. However, an one-way ANOVA revealed that at least two of the student pre-test factor I mean scores across computer experience for the 18-21 age group were significantly different (Table 4). A post hoc comparison test revealed the pre-test factor I mean score for the >3 computer experience level (31.6) was significantly different than the mean score for the 0-1 level (25.76) and the mean score for the 2-3 level (25.70). Higher comfort/lower anxiety levels of using computer applications associated with a higher level of computer experience agrees with the results reported by Hoffer, Radke, & Lord (1994) and Billings & Cobb (1992).
Table 5 summarizes the results of controlling student pre-test factor IIc mean scores for computer experience and age. The range of student pre-test factor IIc scores varied from 16 which is associated with the perception that computer applications are somewhat useful to 25 which is associated with the highest level of perceived usefulness.
A one-way ANOVA failed to reveal any significant difference in the student pre-test CAS factor IIc mean scores across all three computer experience levels for the 18-21 age group (Table 6). These results disagree with the results reported by Hoffer, Radke, and Lord (1994) who found students with increasing levels of computer literacy were also increasingly more positive toward the usefulness of computers. Students' perceptions of computer application usefulness not being affected by computer experience could be attributed to students constantly being exposed to outside sources (e.g., friends, family, professors, and media) who share with them the advantages of computer technology. This constant exposure to the benefits of computer technology by these outside sources could result in students of various computer experience levels to rate computer applications as being useful even if they do not have any experiences associated with these applications.
The results of measuring student attitudes toward computers in this study reinforced the notion that feelings of comfort/anxiety in using computer applications are significantly related to computer experience and familiarity (Dyck & Smither, 1994; Billings & Cobb, 1992; Kulik, Kulik, & Bangert-Downs, 1985; Loyd & Gressard, 1984b) and revealed that these feelings of comfort in using computers improved during the semester.
Table 4 ANOVA summary for student pretest CAS Factor I scores across computer experience levels (18-21-year olds)
|
Source |
df |
Ms |
F |
|
Computer experience |
2 |
230.89 |
8.79* |
|
Error |
59 |
26.28 |
|
*p < .05.
Table 5 Student means (and standard deviations) of pretest Factor IIc scores, by computer experience and age.
|
Computer experience |
0-1 |
2-3 |
>3 |
|
Age (yr) 18-21 |
20.27 (2.31)n=21 |
20.29 (2.31) n=21 |
20.47 (2.25) n=20 |
|
22-25 |
21.25 (1.48) n=4 |
22.50 (1.50) n=2 |
22.67 (1.89) n=3 |
|
26-29 |
23.00 (1.22) n=4 |
|
22.00 (¾ ) n=1 |
|
30-33 |
18.67 (1.89) n=3 |
21.00 ( ¾ ) n=1 |
|
|
>33 |
19.67 (1.25) n=3 |
|
25.00 ( ¾ ) n=1 |
Interactive Digital Video Activity Evaluations
Table 7 summarizes the percentage of the participants who rated the instructional techniques used in the five activities as effective and very effective in helping them learn the physics concepts found in the materials. The majority of the students felt these techniques were at least effective in helping them learn. At least 50% of the participants felt the following instructional techniques were very effective: discussion (4 out of 5 activities), capturing the experiment on video (3 out of 4), playing back the video (4 out of 5), making measurements from the video (1 out of 3), tracing the motion of an object captured on video (2 out of 2), and visual space-time diagrams (1 out 3). Each of these instructional techniques, except for discussion, was related to the use of the two interactive computer programs, Video Analyzer and Visual Space-Time.
The students’ common reaction toward the visualization techniques provided by these interactive computer programs was one of amazement and wonder (Escalada, Grabhorn, & Zollman, 1996). Students were impressed with the capability of being able to capture and playback an experiment they had just performed. The following student comments reflect the positive effect the visualization techniques had on their understanding and comprehension: "Being able to trace the motion of the objects helped me understand the concepts associated with the activities." "The visual computer images of the object helped me understand the concepts of motion and reference frames better." "Seeing a record of the experience was a big plus as far as understanding the concepts was concerned." These comments seem to indicate that the interactive digital video computer programs increased student motivation to learn and student understanding of the concepts associated with the activities.
Table 6 ANOVA summary for student pretest CAS Factor IIc scores across computer experience levels (18-21-year olds)
|
Source |
df |
Ms |
F |
|
Computer experience |
2 |
.2505 |
.0478 |
|
Error |
59 |
5.244 |
|
Table 7 Percentage of participants who rated the following instructional techniques as effective (very effective) in helping them learn
|
Instructional techniques |
Activity |
||||
|
1 |
2 |
3 |
4 |
5 |
|
|
Introduction |
42% (18%) |
44% (33%) |
31% (27%) |
51% (21%) |
48% (26%) |
|
Capture |
42% (45%) |
33% (53%) |
NA |
35% (60%) |
37% (64%) |
|
Playback |
33% (57%) |
30% (59%) |
43% (42%) |
42% (53%) |
28% (72%) |
|
Measurement |
38% (42%) |
43% (42%) |
35% (50%) |
NA |
NA |
|
Calculation |
37% (25%) |
38% (30%) |
37% (46%) |
NA |
NA |
|
Trace |
NA |
NA |
NA |
25% (75%) |
22% (78%) |
|
VSTDs |
29% (29%) |
51% (25%) |
NA |
43% (50%) |
NA |
|
Application |
33% (15%) |
38% (29%) |
38% (48%) |
55% (23%) |
66% (17%) |
|
RP exercises |
NA |
NA |
NA |
NA |
47% (33%) |
|
Discussion |
36% (54%) |
31% (46%) |
23% (61%) |
31% (59%) |
33% (64%) |
|
Sample size |
n = 56 |
n = 52 |
n = 52 |
n = 40 |
n = 36 |
NA = Not applicable.
To address the question of whether participants' ratings of an activity's effectiveness in helping them learn and/or ease-of-computer use were influenced by their prior computer experience, mean activity effectiveness ratings were controlled for computer experience. Table 8 summarizes the participant mean activity effectiveness ratings across computer experience levels. The mean activity's effectiveness ratings ranged from 3.76 for Activity #1 (0-1 level of computer experience) to 4.64 for Activity #5 (>3 level of computer experience). Table 9 summarizes the mean ease-of-computer use ratings across computer experience levels. The mean ease-of-computer use ratings varied from 3.40 for Activity #1 (2-3 level of computer experience) to 4.56 for Activity #3 (>3 level of computer experience). The participants who completed the first activity rated it the lowest ease-of-computer use mean rating (3.77) while the students who completed the third activity rated it the highest east-of-computer use mean rating (4.21).
Comparing the participants' mean ratings for the first activity with the ratings for the second activity, one notices from Tables 8 and 9 that the ratings shifted to a higher activity effectiveness and to a higher ease-of-computer use mean rating, respectively. The results are not surprising because the majority of the participants who completed the first activity also completed the second (67%). These students should rate the ease-of-computer use and effectiveness in the second activity higher because of their previous experience with the computer applications in the first activity. In general, the mean difficulty ratings indicate that the participants felt the activities were not difficult to use.
The mean activity effectiveness ratings and mean ease-of-computer use ratings across computer experience levels (Tables 8 and 9) were analyzed for significant differences by performing an one-way ANOVA and Table 10 summarizes the results. Three of the 10 tests failed the homogeneity of variance test which must be passed to prevent an inflation of Type I error and as a result were statistically unreliable. The remaining tests for both activity effectiveness and ease-of-computer use ratings failed to show up any significant differences for these ratings across computer experience levels. The results of these tests indicate that neither the participants' ratings of the activity's ease-of-computer use nor the activity's effectiveness in helping them learn were affected by computer experience. In this case a conclusion of "no significant difference" can be considered quite positive. The students had a broad range of computer experience, yet the ratings of effectiveness and ease-of-computer use were not related to that experience.
The following student comments also reflect how easy the computer programs were to use and effectiveness of these programs in helping them learn: "With the instructions provided with the activities, one doesn’t really have to know much about computers to run the programs." "The computer programs were easy to use and made it easier to understand the concepts." "The activities were very challenging and I improved with experience in using the computer applications."
Table 8 Participant mean (and standard deviation) activity effectiveness ratings across computer experience levels for each activity|
Computer experience |
Activity |
||||
|
1 |
2 |
3 |
4 |
5 |
|
|
0-1 |
3.76 (1.39) n=25 |
4.05 (.86) n = 21 |
4.35 (.81) n = 20 |
4.40 (.74) n = 15 |
4.38 (.62) n = 16 |
|
2-3 |
3.80 (1.01) n=15 |
4.25 (.77) n = 16 |
4.12 (.81) n = 16 |
4.17 (.83) n = 12 |
4.33 (.50) n = 9 |
|
>3 |
4.25 (1.00) n = 16 |
3.94 (1.44) n = 16 |
4.19 (.75) n = 16 |
4.50 (.67) n = 12 |
4.64 (.50) n = 11 |
|
Total |
3.19 (1.20) n = 56 |
4.08 (1.03) n = 53 |
4.23 (.78) n = 52 |
4.36 (.74) n = 39 |
4.44 (.56) n = 3 |
Note. 1 = Lease effective; 5 = most effective.
Table 9 Participant mean (and standard deviation) ease of computer use ratings across computer experience levels for each activity
|
Computer experience |
Activity |
||||
|
1 |
2 |
3 |
4 |
5 |
|
|
0-1 |
4.00 (.82) n=25 |
4.14 (.91) n = 21 |
4.15 (.88) n = 20 |
4.20 (.68) n = 15 |
4.19 (.54) n = 16 |
|
2-3 |
3.40 (.91) n=15 |
4.00 (.52) n = 16 |
3.94 (.68) n = 16 |
3.83 (.94) n = 12 |
3.56 (1.24) n = 9 |
|
>3 |
3.75 (.93) n = 16 |
4.00 (1.15) n = 16 |
4.56 (.63) n = 16 |
4.33 (.89) n = 12 |
4.36 (.92) n = 11 |
|
Total |
3.77 (.89) n = 56 |
4.06 (.89) n = 53 |
4.21 (.78) n = 52 |
4.13 (.83) n = 39 |
4.08 (.91) n = 36 |
1 = Difficult; 5 = easy.
Table 10 ANOVA summaries for student activity effectiveness and ease of computer use ratings across computer experience levels for each activity
|
Activity |
Activity ratings |
Difficulty ratings |
|
1 |
F(2,53) = .905 |
F(2,53) = 2.21 |
|
2 |
F(2,50) = .368a |
F(2,50) = .159a |
|
3 |
F(2,49) = .393 |
F(2,49) = 2.90b |
|
4 |
F(2,36) = .628 |
F(2,36) = 1.18 |
|
5 |
F(2,33) = .951 |
F(2.33) = 2.32a |
*p < .05.
*Fails homogeneity of variance test.
b
p = .064.Based on student comments and the analysis of student ratings, the interactive digital video tools and activities can be considered "user friendly" and conducive to an activity-based environment in which the students could investigate the relationships between the concept of reference frames and the concepts being introduced in each activity. Thus, we can conclude that one can create effective instructional software which is perceived as easy-to-use and effective by novices and experts. Such a conclusion should be encouraging to instructional software developers. "User friendly" and interactive computer programs assure that a higher probability of students and teachers will utilize these technologies in physics classrooms as a result of being comfortable in using these technologies. McDermott (1991), however, cautions that even a highly interactive computer program provides no guarantee that students will be engaged at a sufficiently deep level for significant concept development to occur. This warning provides the motivation for future research.
Final Exam
Table 11 illustrates the mean scores for the final exam questions which were related to the video activities. For those final exam questions related to the concepts associated with Activities # 1, 2, 3, and 5; both participants and non-participants performed rather well. The average score for these activities for all 100 students was 86% correct. However, neither group fared very well on the final exam questions related to physics concepts found in Activity # 4. The average score for this activity for all 100 students was 54% correct.
Activity-related questions from Activities # 1 and 3 mainly focused on kinematics and momentum calculations. Questions from Activities # 2, 4, and 5 focused on the qualitative relationships between reference frames and the particular topics. Because of the small number of questions related to Activities # 2 and 5, one has to evaluate the students' performance on the qualitative understanding of reference frames based on the scores from Activity # 4. From these results, all students performed well on the quantitative activity-related questions, but not on the qualitative activity-related questions that focused on reference frames.
Table 11 Activity-related final exam question mean scores for participants and nonparticipants.|
Activity |
1 (8) |
2 (4) |
3 (6) |
4 (8) |
5 (2) |
|
Participants |
6.54 n = 56 |
3.47 n = 53 |
5.19 n = 52 |
4.26 n = 39 |
1.73 n = 37 |
|
Nonparticipants |
6.32 n = 44 |
3.53 n = 47 |
4.88 n = 48 |
4.43 n = 61 |
1.84 n = 63 |
|
Total |
6.44 n = 100 |
3.50 n = 100 |
5.04 n = 100 |
4.36 n = 100 |
1.80 n = 100 |
Note. Numbers in parentheses indicate maximum score possible for each activity.
These scores were analyzed by calculating an analysis of covariance (ANCOVA) with an independent variable of group (consisting of participants and non-participants), a covariate of total final exam score, and a dependent measure of activity-related final exam question scores. Final exam scores were used as a covariate for the analysis because one would predict a strong relationship between the total final exam score and any results on activity-related final questions. The summary of the ANCOVA results is found in Table 12.
For all five activities, the final exam score was significantly related to the activity-related scores. For four out of five activities, the group and total final exam scores explain a significant amount of the variance. The main effect of group for all five activities failed to show any significant difference, and as a result the unadjusted means (means not adjusted for the covariate) found in Table 12 were nearly identical to the adjusted means (means adjusted for the covariate) found by doing the ANCOVA. The mean activity-related scores did not need to be adjusted for the final exam scores.
One-way ANOVA's were performed for all five groups of activity-related scores so no statistical power would be lost. The results were similar to results found by performing the ANCOVA procedure. No significant differences were found between participants' activity-related scores and the non-participants' activity-related scores. Those students that participated in the interactive digital video activity did not do better on the activity-related questions than those students who did not participate in the activity.
Table 12 ANCOVA summaries for each activity
|
Activity |
Covariate (final) |
Main effects (group) |
Explained (final + group) |
|
1 |
F(1, 97) = 9.62* |
F(1,97) = .414 |
F(2,97) = 5.02* (R2 = .094) |
|
2 |
F(1, 97) = 15.38* |
F(1,97) = .396 |
F(2,97) = 8.08* (R2 = .142) |
|
3 |
F(1,97) = 4.45* |
F(1,97) = .345 |
F(2,97) = 2.68 (R2 = .052) |
|
4 |
F(1,97) = 37.28* |
F(1,97) = .001 |
F(2,97) = 18.64* (R2 = .278) |
|
5 |
F(1,97) = 9.05* |
F(1,97) = .342 |
F(2,97) = 4.69* (R2 = .088) |
*p < .05.
The final exam mean scores for the participants (students who completed at least one activity) and non-participants are summarized in Table 13. The participants' final exam mean score was 109 out of a possible 150, while non-participants' final exam mean score was 101 out of a possible 150. An one-way ANOVA was calculated to determine if any significant difference existed between the participants' final exam mean score and the non-participants ' final exam mean score. The results of the one-way ANOVA are summarized in the Table 14.
Table 13 Student mean (and standard deviations) final exam scores for participants and nonparticipants
|
Group |
Final exam mean scores |
|
Participants (n = 87) |
109/150 (15) |
|
Nonpartcipants (n = 13) |
101/150 (18) |
Table 14 ANOVA summary for student final exam scores for participants and nonparticipants (group)
|
Source |
df |
Ms |
F |
|
Group |
1 |
725.76 |
2.94 (p = .089) |
|
Error |
98 |
246.51 |
|
*p < .05.
The results of the one-way ANOVA, which compares final exam scores of the participants and non-participants (Table 14), reveal no significant difference between the participants' final exam mean score and the non-participants' final exam mean score. Participants did not have significantly higher final exam scores than non-participants. In viewing this lack of difference a number of factors are critical:
As with many similar studies, the gain in knowledge as a result of the treatment shows no significant difference. This result is not surprising when one considers the diversity of students, their backgrounds, and their learning styles. For some students, the activities provided valuable learning; for others, it did not. These differences averaged out in a statistical analysis. In addition, the limitations of using a multiple-choice assessment and short time-on-task found in this study provides direction for future research involving the effect of interactive digital video on student learning.
Conclusions
Regarding student computer attitudes, the investigation revealed:
In regards to students' perceptions of the video activities, the investigation found:
Regarding relative student gains in learning, the investigation revealed:
The interactive digital video tools and activities were developed for students with a variety of mathematical, science, and computer backgrounds. The students involved in this investigation do not have strong backgrounds in these areas and traditionally avoid physics. Thus, this exploratory study allows us to see how these students respond to the use of sophisticated digital techniques that were utilized in the interactive video tools and activities and if these tools and activities were appropriate for the Concepts of Physics course designed for these types of students.
Teachers at all grade levels will be increasing the use of video and computer technologies in their classrooms. Courses taken by future teachers must provide examples of appropriate hands-on-use instruction using these technologies. In addition, courses taken by future science teachers must provide examples of how these technologies can be integrated with appropriate "hands-on-use" and "minds-on-use" instructional techniques in the learning of science (National Research Council, 1996; Zollman, 1994).
Some instructors fear that the use of technology will create anxiety among students with little computer backgrounds and, thus, could cause a decrease in learning. This study counters that point of view. We used cutting edge technology, including student capture of digital video. None of the students had used this technology prior to the study. Even though they used a very sophisticated system, their comfort with computer technology increased. Thus, we see instructional technology can have a positive effect on future teachers even when the technology is beyond any of their prior experience or knowledge.
The interactive digital video activities illustrate how technology and scientific inquiry can be integrated into a learning environment where students are given effective methods to visualize, explore, investigate, analyze, and understand physics concepts. The results of this study demonstrate that interactive digital video materials were appropriate for the activity-based environment utilized in the Concepts of Physics course and have the potential to provide physics teachers with effective exploration and application activities that incorporate existing resources and the latest user-friendly technology to bring the active process of learning physics in their classroom.
The research reported in this article was supported by a grant from the National Science Foundation (Grant No. MDR-9150222: Digital Video Interactive-A Case Study in Physics).
References
Atash, M. N., & Dawson, G. O. (1986). Some effects of the ISCS program: A meta- analysis. Journal of Research in Science Teaching, 23,377-385.
Beichner, R. J. (1996). The impact of video motion analysis on kinematics graph interpretation skills. AAPT Announcer, 26(2), 86
Beichner, R. J. (1990). The effect of simultaneous motion presentation and graph generation in a kinematics lab. The Physics Teacher, 27, 803-815.
Billings, D. M., & Cobb, K. L. (1992). Effects of learning style preferences, attitudes and GPA on learner achievement using computer assisted interactive videodisc instruction. Journal of Computer-Based Instruction, 19(1), 12-16.
Blissett, G., & Atkins, M. (1993). Are they thinking? Are they learning? A study of the use of interactive video. Computers in Education, 21(1/2), 31-39.
Brassell, H. (1987). The effect of real-time laboratory graphing on learning graphic representations of distance and velocity. Journal of Research in Science Teaching, 24, 385-395.
Brungardt, J. B. & Zollman, D. A. (1996). The influence of interactive videodisc instruction using real-time analysis on kinematics graphing skills of high school physics students. Journal of Research in Science Teaching, 32(8), 855-869.
Cadmus, R. R. Jr. (1990). A video technique to facilitate the visualization of Physical Phenomena. American Journal of Physics, 58(4), 397-399.
Chaudhury, S. R., & Zollman, D. A. (1994). Image processing enhances the value of digital video in physics instruction. Computers in Physics Education, 8(5), 518-523.
Delcourt, M. A. B., & Kinzie, M. B. (1993). Computer technologies in teacher education: the measurement of attitudes and self-efficacy. Journal of Research and Development in Education, 27(1), 35-41.
Dyck, J. L., & Smither, J. A. (1994). Age differences in computer experience, gender, and education. Journal of Educational Computing Research, 10(3), 239-248.
Escalada, L. T. , Rebello, N. S., & Zollman, D. A. (1996). Solids & Light: Explorations of Quantum Effects in Light Emitting Diodes. Manhattan, KS: Kansas State University.
Escalada, L. T., Grabhorn, R., & Zollman, D. A. (1996). Applications of interactive digital video in a physics classroom. Journal of Educational Multimedia and Hypermedia, 5(1), 73-97.
Escalada, L. T., Grabhorn, R., & Zollman, D. A. (1994a). Interactive Digital Video Activities Teacher's Manual, unpublished, 1-19.
Escalada, L. T., Grabhorn, R., & Zollman, D. A. (1994b). Interactive Digital Video Activities, unpublished, 1-58.
Fuller, R., & Zollman, D. (1995). Physics InfoMall. Armonk, NY: Learning Team.
Gable, R. K. (1986). Instrument Development in the Affective Domain. Boston, MA: Kluwer-Nijhoff.
Graney, C. M., & DiNoto, V. A. (1995). Digitized video images as a tool in the physics lab. The Physics Teacher, 33(7), 460-463.
Hersey, T. (1990). Teacher's Guide to Advanced Placement Courses in Physics: Physics B and Physics C. New York, NY: Advanced Placement Program, The College Board.
Hoffer, T., Radke, J., & Lord, R. (1992). Qualitative/quantitative study of the effectiveness of computer-assisted interactive video instruction: the hyperiodic table of elements. Journal of Computers in Mathematics & Science Teaching, 11(1), 3-12.
Jones, T., & Clarke, V. A. (1994). A computer attitude scale for secondary students. Computers in Education, 22(4), 315-318.
Karplus, R. (1977). Science teaching and development of reasoning. Journal of Research in Science Teaching, 14(2), 169-175.
Kelly, G. J., & Crawford, T. (1996). Students’ interaction with computer representations: analysis of discourse in laboratory groups. Journal of Research in Science Teaching, 33(7), 1996.
Koballa, T. R. (1984). Goals of science education. In D. Holdzkom & P.B. Lutz (Eds.), Research within reach: Science education (p. 31). Washington, DC: National Science Teachers Association.
Kulik, J., Kulik, C., & Bangert-Downs, R. (1985). Effectiveness of computer-based learning tools. Computers in Human Behavior, 1, 59-74.
Larsen, R. E. (1992). Relationship of learning style to the effectiveness and acceptance of interactive video instruction. Journal of Computer-Based Instruction, 19(1), 17-21.
Laws, P. W., & Cooney, P. J. (1996). Constructing spreadsheet models of MBL and video data. AAPT Announcer, 25(4), 32.
Laws, P. W. (1995, March). Physics Without Lectures. Talk presented at the Department of Physics Colloquium at Kansas State University.
Laws, P. W. (1992). Computer-based video analysis of physical phenomena. AAPT Announcer, 22(4), 58.
Laws, P. W. (1991). Calculus-based physics without lectures. Physics Today, 24, 24-31.
Likert, R. (1932). A technique for the measurement of attitudes. Archives of Psychology, 140, 1-55.
Loyd, B. H., & Gressard, C. (1984a). Reliability and factorial validity of computer attitude scales. Educational and Psychological Measurement, 44(2), 501-505.
Loyd, B. H., & Gressard, C. (1984b). The effects of sex, age, and experience on computer attitude components. Association for Educational Data Systems, 18(2), 67-77.
McDermott, L. C. (1991). Millikan Lecture 1990: What we teach and what is learned-closing the gap. American Journal of Physics, 59(4), 301-315.
Nakhleh, M. B. (1994). A review of microcomputer-based labs: how have they affected science learning? Journal of Computers in Mathematics & Science Teaching, 13(4), 368-380.
National Research Council. (1996). National Science Education Standards. USA: National Academy Press.
Patterson, E. T. (1996). Using "homemade" tools to analyze digital video. AAPT Announcer, 25(4), 87.
Rubin, A. (1993). Communication Association of Computing Machinery, 36(5), 64.
Shymansky, J., Kyle, W., & Alport, J. (1983). The effects of new science curricula on student performance. Journal of Research in Science Teaching, 20(5), 387-404.
Sobolewski, S. J. (1996). Development of multiple-choice test items. The Physics Teacher, 34(2), 80-82.
Stohr-Hunt, P. (1996). An analysis of frequency of hands-on experience and science achievement. Journal of Research in Science Teaching, 33(1), 101-109.
Thornton, R. K., & Sokoloff, D. R. (1990). Learning motion concepts using real-time microcomputer-based laboratory tools. American Journal of Physics, 58, 858-867.
Wilson, J. M., & Redish, E. F. (1992). The comprehensive unified physics learning environment, part I: background and system operation. Computers in Physics, 6(2), 202-209.
Zollman, D. A. (1994, Fall). Fall, 1994 Semester Final Exam for Concepts of Physics course. Unpublished, 1-7.
Zollman, D. A. (1994). Preparing future science teachers: the physics component of a new programme. Physics Education, 29, 271-275.
Zollman, D. A. (1990). Learning cycles in a large enrollment class. The Physics Teacher, 28, 20-25.
Zollman, D. A., & Fuller, R. G. (1994). Teaching and learning physics with interactive video. Physics Today, 47(4), 41-47.
Zollman, D. A., Noble, M. L., & Curtin, R. (1987). Modeling the motion of an athlete: an interactive video lesson for teaching physics. Journal of Educational Technology Systems, 15(3), 249-257.