Visual
Quantum Mechanics
Wave Function Sketcher
STEP 1: Changing the Potential
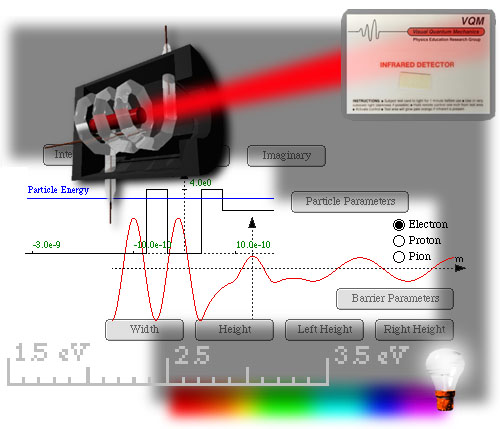
The program uses a square potential barrier/well. Begin by changing the depth and width of the potential barrier/well. Click on the "Potential" tab at the bottom of the screen.
Change the Width of the Potential: Use the slider in the "Width" tab inside the "Potential" tab. The default width is 0.1nm, but it can be varied from 0 to 1nm. Observe the width of the potential energy diagram change at the top of the screen, and the value of the width displayed in the text box adjacent to the slider. You can also change the width by clicking one of the walls of the potential barrier, at the top of the screen and dragging it left or right. The other wall of the potential barrier mirrors the change.
Change the Height of the Potential: Use the slider
in the "Height" tab inside
the "Potential" tab. The default height is 2.0eV, but it can be varied
from -5.0eV to 5.0eV. Positive values of height correspond to a potential
barrier, while negative values correspond to a potential well.
Observe the width of the potential energy diagram change at the top of the screen, and the value of the height displayed in the text box adjacent to the slider. You can also change the depth by clicking on the top of the potential barrier at the top of the screen and moving it up or down.
STEP 2: Change the Total Energy
Click the "Total Energy" tab at the bottom of the screen, and adjust the slider in it to change the total energy of the electron. The default value of the total energy is 1eV, but it can be changed from -5eV to 5eV. Observe the horizontal blue total energy line in the potential energy diagram above change consequently, and the total energy value displayed in the textbox adjacent to the slider. You can also change the total energy using by clicking on the horizontal blue total energy line in the potential energy graph and dragging it up or down.
STEP 3: Defining the Region Boundaries
To create the regions, adjust the positions of the thin dashed vertical lines
that run across both the potential energy and wave function graphs.
Region I - Region II Boundary: Click on the left line and drag it to the
appropriate positions. This line defines the boundary between Region I and
Region II.
Region II - Region III Boundary: Click on the right line and drag it to the
appropriate positions. This line defines the boundary between Region
II and Region III.
STEP 4: Sketching the Wave Function in Any Region
Choosing the Region: Choose the desired Region I, II, or III; using the appropriate
tab at the bottom of the screen.
Choosing the Shape of the Wave Function: Depending upon the total energy
and potential energy in the chosen Region, decide whether the wave functions
will
be oscillating or decreasing. Click on the appropriate radio button in
the Region tab.
After choosing the type of wave function (Oscillating or Decreasing) change
the parameters of the wave function using the appropriate tab.
For an oscillating wave function, change the "Amplitude", "Wavelength", and "Phase" of the wave function using the sliders in each of the tabs. For a decreasing wave function use the "Shape" tab to choose where the highest point of the wave function is and, thus, connect this part of the wave function to the part(s) in the other regions. Use the "Amplitude" for the value of the highest point and the "Decrease Length" to determine how quickly the wave function decreases.