 |
|||
 |
|||
This on-line tutorial introduces some physics related to fluorescence and the emission of light by solids. As part of the interactive nature of this tutorial you should record answers to the questions posed and observations completed. We recommend that you paste each question into your word processor and type your answer. For sketches you may capture our images and add to them with a drawing program.
- Introduction
- In solids the energy bands are separated by an energy gap that results from the interactions of numerous closely spaced atoms. These energy bands and gap play a very important role in the light emission process of luminescent materials and devices because most of these materials and devices consist of solids.
If electrons in the valence band are supplied enough energy — mechanical, chemical, electrical, or light — they change to energy levels in the conduction band. These electrons can lose this recently acquired energy in the form of light by changing from energy levels in the conduction band to energy levels in the valence band. In some cases the energy supplied to these valence electrons equals the energy of the light emitted by the luminescent solid; in others only a fraction of the incoming energy goes out as light.
Fluorescence, for example, involves a luminescent solid absorbing ultraviolet (UV) light and emitting visible light. Because UV light has higher energy than the visible light, the simple energy band and one gap model cannot explain this process. Thus, the simple energy band model needs to be modified to explain fluorescent materials.
- Observing Fluorescent Light
- Before creating a model for fluorescence, you should look at the light beging emitted by fluorescent tubes. Look at several different tubes and notice any color differences. If you have a diffraction grating or spectroscope, look at the spectra of these tubes. Record any similarities or differences.
DO NOT LOOK DIRECTLY AT TANNING LAMPS OR GERMICIDAL LAMPS. EYE DAMAGE CAN OCCUR.
- A Model of Solids with Impurities
- In the simplest Kronig-Penny model each atom of the solid is represented by a single square well with the same depth. Thus, all atoms in this model of a solid are identical. For most real solids, this assumption does not hold true. A Kronig-Penny model for a solid with more than one element will have square wells with different width and/or depths. A solid which is only slightly more complex than a pure substance has two elements. Most of the atoms are one element with a few being a second impurity element. You will now use the Energy Band Creator to determine the effect on energy levels in a solid with one impurity which is represented by a deeper square well.
- Energy Diagram of Solids
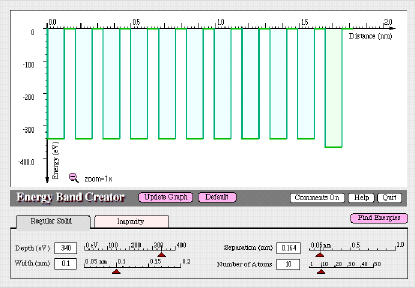
- With the Regular Solid tab visible, create 10 potential energy diagrams that have a depth of -300 eV, a width of 0.1 nm, and a separation distance of 0.15 nm. Then, click on the Impurity tab and change the Impurity Concentration from 0 to 1. Notice that one of the regular solid potential energy diagrams has turned green. However, it still represents an atom that is identical to the others because its potential energy diagram is identical. To create an impurity, change the depth to -340 eV. Keep the width at 0.100 nm. The figure below illustrates the resulting potential energy diagram representation of the solid with a single impurity atom.

Allowed Energies
- Use the program to search for the allowed energies. The red allowed, energy lines result from the interaction of the regular solid potential energy diagrams and the green allowed, energy lines result from the impurity potential energy diagram. Sketch the resulting allowed energies.
Notice in your results that the allowed energies related to the impurity are found inside the energy gap (between the conduction and valence bands) and below the valence band.
Now use the Energy Band Creator to see what happens to energy states when the depth of the impurity is less than the other wells. Record your results.
Energies with More Impurities
- Suppose that you were to add several more impurity atoms to the solid. Before doing it, predict how the energies would change if the impurities have a greater charge than other atoms in the solid. Sketch the allowed energies for a solid in which several impurity atoms have been added.
Then modify the solid represented in the computer program to contain more than one impurity atom. Look at enough situations so that you can describe how the allowed energies change as the number of impurity atoms increase.
Summarizing Energy Bands
- When a large number of impurity atoms are added to the solid, a band of energies form in the band gap of the material. The placement of this band depends on the nuclear charge of the impurity atoms. This band, the impurity band, along with the conduction (excited state) and valence (ground state) bands are characteristic of the luminescent solids that make up objects such as fluorescent minerals, phosphorescent toothbrushes, and the coating found inside fluorescent tubes.
So far we have used an extremely large concentration of impurities so that we could emphasize how the impurity band is created. In real solids, the impurity concentration is typically on the order of 10-6.
You have now completed using Energy Band Creator. We suggest that you close the window containing the program so that you conserve memory resources on your computer.
Exploring Light Emissions from Solids with Three Energy Bands
- Now that we see how an extra energy band can be created, we will use the idea to understand fluorescence. Fluorescence Spectroscopy in Spectroscopy Lab Suite applies the concept of energy bands to explain the light emission from fluorescent lamps.
Energy Bands and Fluorescence
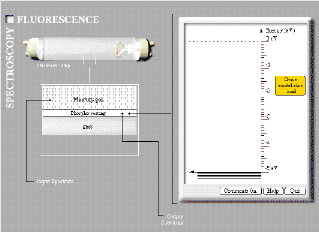
- The energy diagram on the right of the computer screen represents the material in the phosphor. The black set of horizontal lines at -5 eV represent the valence band of the phosphor coating. Click on the Create Excited State Band (conduction band) button, then on the Create Impurity State Band button. A set of gray horizontal lines representing these bands appear. You may drag the energy bands to other values.
An energy scale labeled Input Spectrum will now appear below the cross section of the fluorescent tube. The input spectrum corresponds to the energy of light emitted by the mercury gas and striking the phosphor coating. Visible light in this spectrum passes through the glass tube and is characteristic of the mercury gas spectrum. UV light is absorbed by valence electrons of the phosphor.
Vary the energy of the input spectrum and the energies of the conduction and impurity bands so that you can determine the conditions necessary for the lamp to turn on. Record your observations.
Energy Levels in Fluorescence
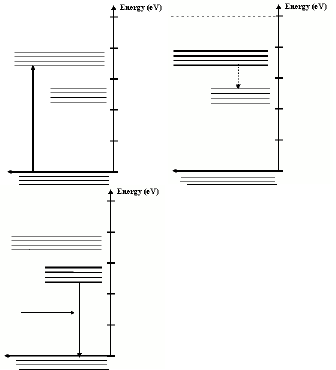
- The first step in any light emitting process is to give electrons in the lowest energy states enough energy to change to a higher energy level (Figure 3). In a solid with an impurity band the electrons in the conduction band do not necessarily lose all their energy at once and return directly to the ground state. Instead, these electrons lose enough energy to nearby atoms that they move from the conduction band into the impurity band. This transition is represented by a dashed arrow which is illustrated in the animation.
The output spectrum which we see is the result of electrons losing energy as they move from the impurity state band to the ground state band.
Ordinary fluorescent tubes operate when an electric current passes through a tube filled with mercury gas. The excited mercury atoms emit visible and UV light. The UV light which has an energy of about 3-5 eV is converted to visible light by the process described here.

Bands and Colors of Tubes
- Fluorescent tubes are available in several different colors. You have probably seen grow-lights for house plants which emit a much different color than the “white” tubes used in most houses and schools. Even among the white tubes variations exist. “Cool white,” for example, has more red than “Daylight” tubes. The variation in color is determined by the impurity states in the phosphor.
Use the Fluorescent Spectroscopy computer program to model the operation of a typical “cool white” fluorescent lamp. Click the Edit Properties button and set the input spectrum of the light to approximately 4.8 eV. The color pattern indicated on the scale represents UV light.
Use the mouse to drag the excited state band, which is illustrated on the energy diagram screen, to an appropriate energy.
Move the impurity state band to the appropriate energy so that the fluorescent lamp emits visible light (1.6 eV to 3.1 eV). Remember Cool White lamps have a lot of red. Assume that the resulting visible light will have an energy equal to the average energy for this range of values.
Describe the resulting energy band diagram with the respective energy values and each resulting transition.
How would the bands change for a “Daylight” (more blue) lamp?
Making a Black Light
- By using different types of phosphor materials to coat the fluorescent tubes, the tubes can be engineered to emit light in a wide range of colors and energies from the near-UV to the orange-red. So-called black lights emit in the violet and near-UV regions with an energy of approximately 3.5 eV.
Common fluorescent lamps, black lights, grow lights, and tanning lights all have the same mercury gas inside them. As a result, the excited mercury atoms emit light energy of 4.8 eV.
Use the Fluorescence Spectroscopy computer program and the values of 4.8 eV for the input spectrum and 3.5 eV for the output spectrum to construct an energy band model for the black light. Describe your results and include answers to: • How is the energy diagram for the black light similar to the energy diagram for the “cool white” fluorescent lamp?
• How are they different?
Applying Fluorescence to Minimize Counterfeit Money
- To make counterfeitting more difficult many governments, including the U.S., are using fluorescence. You can see this effect by exposing any new style U.S. currency to UV light. Near one end, a line will appear that cannot be seen with visible light. This fluorescent thread is visible on the front and back of the bill.
Use your knowledge of fluorescence to describe the process by which this part of the currency emits visible light. Then, describe the nature of the solid that is needed to create an appropriate band structure for this process.
