Phosphorescent objects, like fluorescent materials, consist of solids with many identical atoms and a small number of impurities. As a result, energy diagrams of phosphorescent materials have an impurity state energy band located somewhere between the conduction and valence energy bands. If you do not know how the impurity energy band arises, you should complete the fluorescence tutorial before continuing.
Open Phosphorescence Spectroscopy. A figure of a glow-in-the-dark
toothbrush will appear on the left part of the screen and an
energy scale on the right. The energy scale includes a valence
(ground state) band. Create the excited state and impurity state
bands.
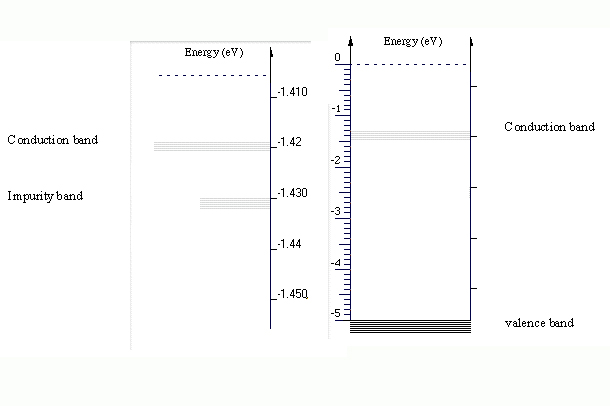
The computer screen is somewhat small for representing the energies involved here. The impurity band energy is very close to the energy of the conduction band. As the figure shows, the difference between the energies of these two bands is about 0.01 eV.
The difference between the energy of the conduction and valence bands is much greater than that energy difference between impurity and conduction bands. The figure below shows that the energy difference between the conduction and valence bands is about 3.5 eV.
![]()
![]()