Exploring the Spectra of Gases
At the beginning of this part of their study students explore the spectra of several gases. This experiment can be performed by looking at standard gas tubes through spectroscopes or by aiming the spectroscopes at street lamps. (Even if the students use the gas tubes, we recommend that they look at street lamps and other common light sources as well.) Once they have collected data we ask them to use results similar to theirs to create an energy level diagram of the gases. The following section includes excerpts from two student activities.
Introducing the Energy Level Diagrams to High School & Non-Science College Students
Our transition from viewing spectra to studying atoms uses the logic: In all cases matter inside the lamp emits the light. This material is made of atoms. So we must learn something about atoms to understand the emission of light.
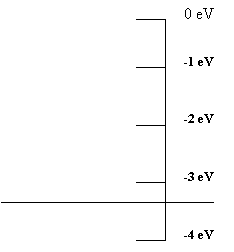
A useful way to describe the energy of electrons
in an atom is to use an energy diagram, which plots the electron's
energy on the vertical axis of a graph. We simply draw a line
at the energy of the electron. As an example the diagram in Figure
1.1 represents an energy of -3.4 eV.

In this scheme the horizontal axis has no particular meaning. We are only dealing with one variable --- the electron's energy. We could just draw dots on the energy axis, but lines are easier to see.
In our studies we will always be interested in electrons that are attached to atoms. So, we place zero energy at the top of the diagram and do not include positive energies.