Extending the Energy Level Model to LEDs
Now, have the students extend their investigation to solids and begin to understand how LEDs emit light. How do these spectra compare with those of a gas? Then, explore how we might create a spectrum similar to that of an LED.
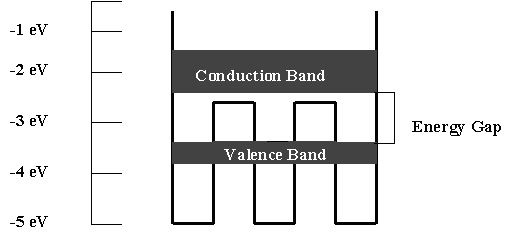
Solids have many atoms that are close together and interact with each other. These interactions create very closely spaced energy levels. In addition to having energy levels which are very close together, a solid has an extremely large number of levels - literally billions and billions. Because of the large number and the close spacing we treat each group as a band of energy levels. When you tried to match an LED spectrum with the Emission Spectroscopy program, you created something similar to an energy band with just a few levels. A solid may have several bands of energy. For the LED, only two of the bands are involved in light emissions. So, it works just like the model you created with closely spaced spectral lines. The band with the highest energy contains electrons that cannot leave the solid but are not firmly attached to any atom. They can move throughout the solid. This freedom of motion allows these electrons to carry (or conduct) energy through the solid. So, we call this band the conduction band.
Electrons that have energies in the next lower band are bound to their respective atoms more strongly and are unable to break free from the atoms. This lower energy band is called the valence band.

No electron energies are allowed between the conduction and valence bands. This range of energies is called the energy gap.
At the beginning of this activity, we used Gas
Lamp Spectroscopy to get an idea about how the energy level
diagram must look to explain the spectrum emitted by an LED. At
that time we created a pseudo-band by putting several energy levels
close together. Now, we will look specifically at the energy bands
in LEDs. In the Spectroscopy Lab Suite software package,
select LEDs. Use this program to see how the spectrum of
an LED depends on the energies of the bands and the gap. Then,
create a set of bands that reproduce the spectrum of an LED that
you observed.