Hydrogen Emission Spectrography
Exploration of Excited Electrons


Looking through a diffraction grating shows us an atomic spectra. The diffraction grating is a series of slits that enable the light from the Hydrogen gas to be broken up into its component colors. The components of this light are called an atomic spectra. In other words, we see a series of colors made by interactions in the gas.

For non Java Browsers: (Close up image)
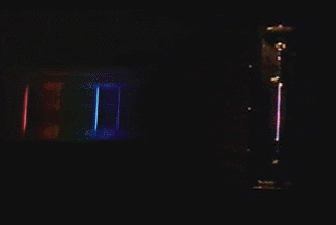
If you have looked at the close up picture of the spectra, you would see scales. The top scale is energy, while the bottom scale is wavelength.
Because we have included both scales we have assumed Planck's hypothosis.


NOTE:
Throughout this tutorial, there will be a series of boxes and choices for you to fill out. This will be an aid, similar to a worksheet, to allow you to think out your answers more clearly. We are also interested in your opinions and answers. All forms will be sent anonymously (we don't request your e-mail or name), so feel free to write however much you feel is necessary to help you. At the current time, your information can be accessed to you again by pressing the back button on your browser.
What wavelengths of light do you see?


What energy values do the colors have?


Do you see any other colors of light?
Yes
No

Describe anything else you observe with the spectra


With the Hydrogen Spectra you see sparate colors of light. These colors relate to energy changes the Hydrogen atom.

Now that we've explored how the spectrum looks, we can see how the spectrum is related to energy changes of the atom.

Let's explore this a little further!


Tutorial:
[Pictures from Spectra ]
[Visible Spectra - Part A ] [Visible Spectra - Part B ]
[Full Spectra - Part A ] [Full Spectra - Part B]
[Graphing Analysis - Part A ] [Graphing Analysis - Part B ]
[Emission]

Further Information:
[Ionization ] [Absorption]

Reference Pages:
[Hydrogen Spectroscopy Index ] [Visual Quantum Mechanics Home]