UltraViolet, Visible and InfraRed Regions
| We've noticed that the accepted energy level diagram for a visible hydrogen spectrum is one with energy jumps from three different high energy levels to a common energy level. | 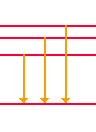 | Using this model as a guide to find the visible spectra, we can explore how this is used with other regions of the Hydrogen Spectra. |
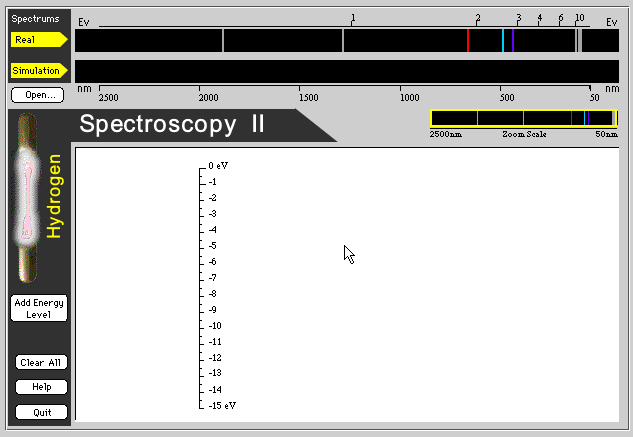
Now we will enter a program that shows four energy colors of Ultra Violet (UV), three energy colors for Visible Light (Visible), and two colors of Infra Red (IR). We can not see the Ultra Violet and Infra Red energy with our eyes so the program will be a simulation of what is detected with other equipment.
Click here to enter the On-Line UV & Visible Hydrogen Spectroscopy Lab
This is a little more tricky because we have nine hydrogen colors to deal with instead of only three.
Part B will not be accessed using the next button, but can be found in the index at the bottom of the page.
"Full Spectra - Part B" will also ask you some questions regarding your discoveries.
|
|
|
Tutorial:
[Pictures from Spectra ]
[Visible Spectra - Part A ] [Visible Spectra - Part B ]
[Full Spectra - Part A ] [Full Spectra - Part B ]
[Graphing Analysis - Part A ] [Graphing Analysis - Part B ]
[Emission]
Further Information:
[Ionization ] [Absorption]
Resource Pages:
[Hydrogen Spectrocsopy Index ] [Visual Quantum Mechanics Home]